The Snap Store web UI can be used to track installation and usage statistics for snaps published with your developer account.
To accomplish this, the store assigns an anonymous identifier, the device-serial, to every new snapd client it sees. This exchange usually happens when a new installation contacts the store, and the identifier persists for the lifespan of the machine.
Systems running snapd will periodically make a refresh request to the store, checking the for the most recent release of each installed snap. At that moment, they inform the store of their device-serial along with a list of the currently installed snaps. The store simply infers the list of active applications from the clients’ requests in a given period.
To access the Snap Store, simply go to https://snapcraft.io/store and login with your developer account credentials. See Using the Snap Store if you don’t yet have an account, and have yet to publish snaps to the store.
Snap Store metrics can also be retrieved with snapcraft metrics command.
My published snaps
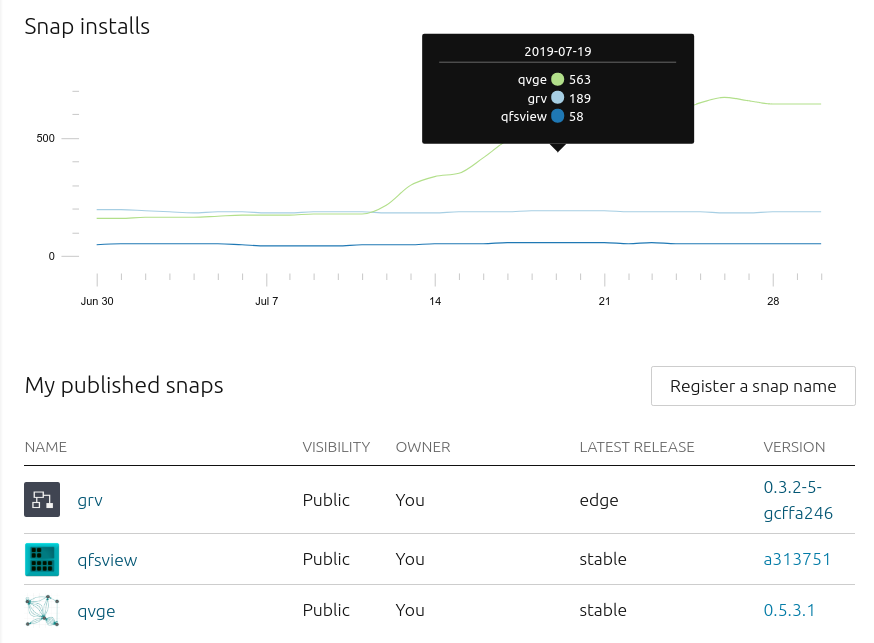
To see a list of snaps published with the currently logged in developer account, select My published snaps from the account drop-down menu in the top right of the web UI.
This page contains a table listing each published snap, with columns to indicate whether a snap is public, its release channel and a corresponding release version.
A chart at the top tracks install numbers for each snap, and rolling over a position in this chart will show individual numbers for a specific time point.
Snap metrics
To see individual metrics for a snap, click the snap from the published snaps page and select the Metrics tab. This page is split into two, with the top-half showing active devices and the lower half showing installation territories.
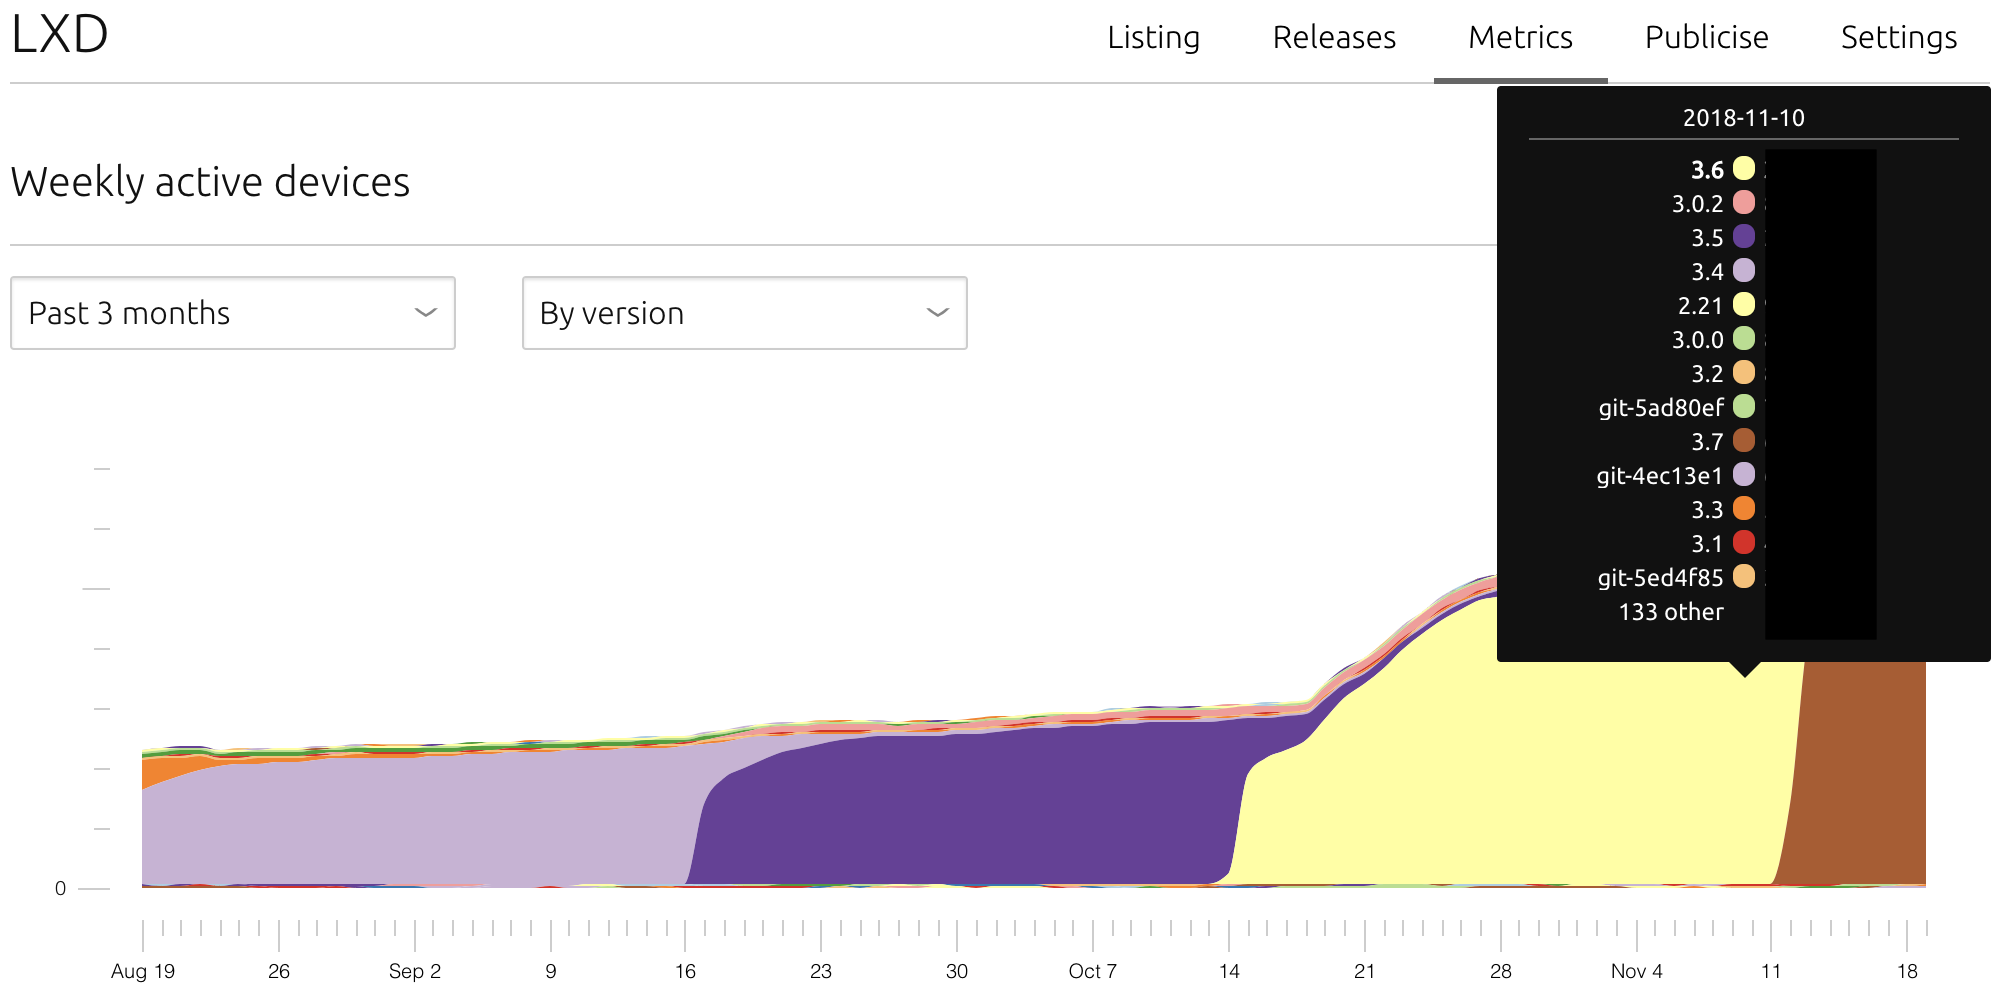
The default active device interval 30 days, and this counts each unique device refresh request for the given snap, reported as installed at least once during a rolling day day period. A drop-down menu changes this interval to a period between, and including, 7 days to 2 years.
The default breakdown of active devices is by version, illustrated by the colour of the filled sections of the chart. These sections help to visualise when and how many users are automatically updated from one version to another after a release. Hover the cursor over any section to see the colour->version key.
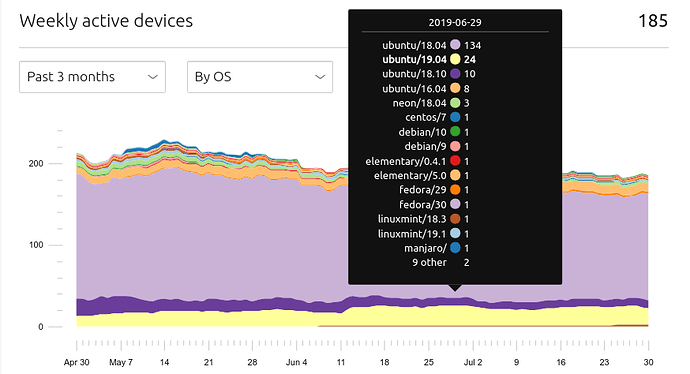
As with the count interval, the breakdown can be switched from By version to either By OS or By channel from its drop-down menu:
- By OS: view the number of active users on each Linux distribution over your selected time-frame. This can help you target integration issues that may be specific to popular distributions.
- By channel: view how many installations are tracking each channel of your snap. Depending on how a snap uses channels, this can be useful to ascertain stability vs. cutting edge features for a snap’s user base.

Territories
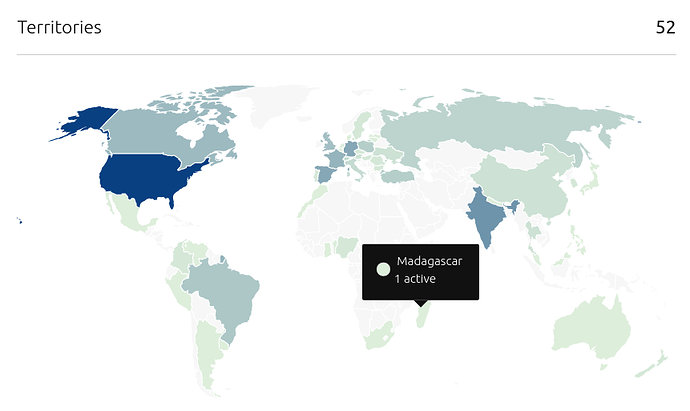
The final visualisation on the Snap Store Metrics page shows the geographical region where a snap is installed. Studying the demography of a snap can help when allocating resources for potential localisation efforts and geographic adoption.
Roll over a region to reveal the specific number of users for that territory.

Last updated 2 years ago.


